(Maybe) Tracking Singapore's Blood Stock Fluctuations
The Red Cross website was redesigned so the technique I use has changed. However, this post is not yet updated with that information.
TLDR
- I wrote a Telegram bot to track Singapore’s blood stock levels (@sgbloodstocksbot). Users can subscribe to the bot to be notified about changes in their blood type’s stock levels (or any changes at all).
- The stock data from 14th June 2021 onwards (constantly updated with new data) is available in this repository in the “Flat Data” format.
Interactive Graphs
Disclaimers
- This is all for personal curiosity and a side-effect of making a (hopefully) useful tool. I am not an expert in any related field.
- I don’t know if it’s a good idea to donate blood only when blood stocks dip below 100%. None of this is advice.
- While it’s a strong hypothesis, there is no strict guarantee that the blood stock levels are accurate. Read Where do you get exact blood stock levels? for more.
Why did I do this?
I was looking to donate my blood sometime in April 2021. Each time I checked the Singapore Red Cross website (scroll down there to see blood stocks), my blood type was fully stocked. It didn’t seem like the most useful time to donate, so I decided to wait.
The (happy) problem was, every time I checked for a while, my stock level was full. When was the best time to donate?.
I decided to make a Telegram bot (try @sgbloodstocksbot here!) that scrapes data from the Red Cross website and pings me when my blood type’s stocks change.
I then heard about Datascape Singapore, a project to save Singapore-related data into “Flat Data” files on GitHub. I used the same code from the Telegram bot to scrape and save the blood stock data daily, from 14th June 2021 onward, into this repository (see blood-stocks.json for the latest scraped data).
Where do I get exact blood stock levels?
The Red Cross website was redesigned so the technique I use has changed. Howver, this post is not yet updated with that information. This section is outdated, but hopefully still interesting.
This is where the (maybe) comes from. There is no official API or data source that I am aware of, so scraping is the only option. The Red Cross reports blood stock levels like this on their website:
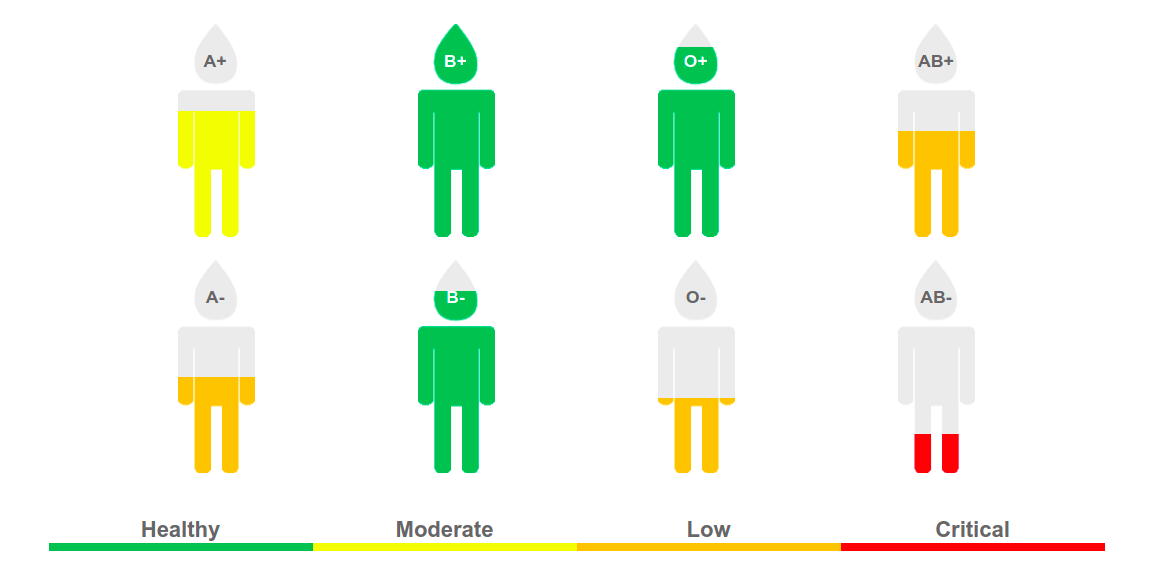
It seems like there are only four preset levels for each blood type: Healthy/Moderate/Low/Critical. That seemed fine at first. I could just report the broad category of blood stock level. However, if you look closer, you’ll notice something curious.
| A- Blood Type | O- Blood Type |
|---|---|
 |  |
Two blood types, both reported as “Low”, have different “fill levels” in the image. Specifically, the HTML representing each image was (note the height parameter):
<!-- A- blood type -->
<div class="fill_humam" style="height: 45%; background: #ffc000;"></div>

<!-- 0- blood type -->
<div class="fill_humam" style="height: 35%; background: #ffc000;"></div>
So maybe there are more presets than expected (increments of 5% each time?). But if we look at the height parameters of some of the other blood level images:
<!-- A+ blood type -->
<div class="fill_humam" style="height: 59%; background: #ffff00;"></div>

<!-- AB- blood type -->
<div class="fill_humam" style="height: 18%; background: #ff0000;"></div>
These blood stock levels seem to be updated to a precision of 1%. One last piece of evidence:
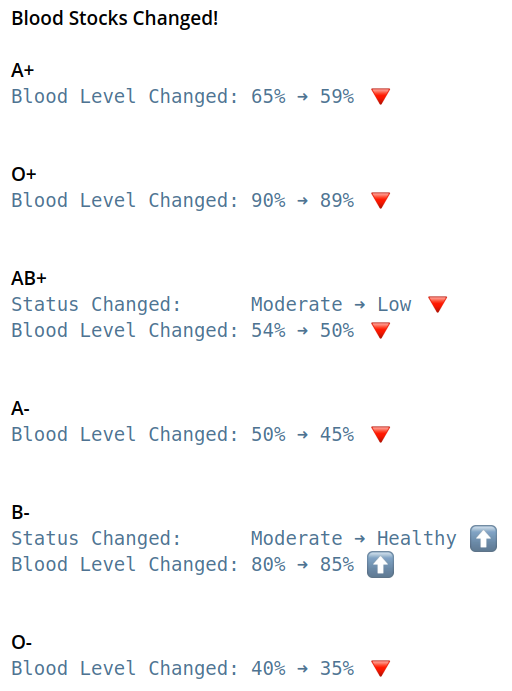
@sgbloodstocksbot pings all subscribers when blood stock levels change (you can watch for a specific blood type or any of them). Notice that the O+ blood type changes only by 1%. Visually, no website user will see a 1% change in the image fill level, so this must be some semi-automated and precise process.
TLDR: I hypothesize that the image fill levels are accurate and precise blood stock levels.
Is this okay?
I get asked sometimes if the blood stock levels are sensitive information and whether I should be publicly broadcasting them. In my view, if the stock levels are accurate, and are already publicly updated by the Red Cross to within 1% (even if it’s encoded within an image), then I’m just using public data. My only intention is to create a useful service to know when to donate blood.
Overview of the data
Downloading and plotting
The blood stock data is stored in this repository, but each update is a separate git commit. We first have to download all versions of blood-stocks.json across all commits. The code to download and analyze the most up-to-date data is here, feel free to give it a go!
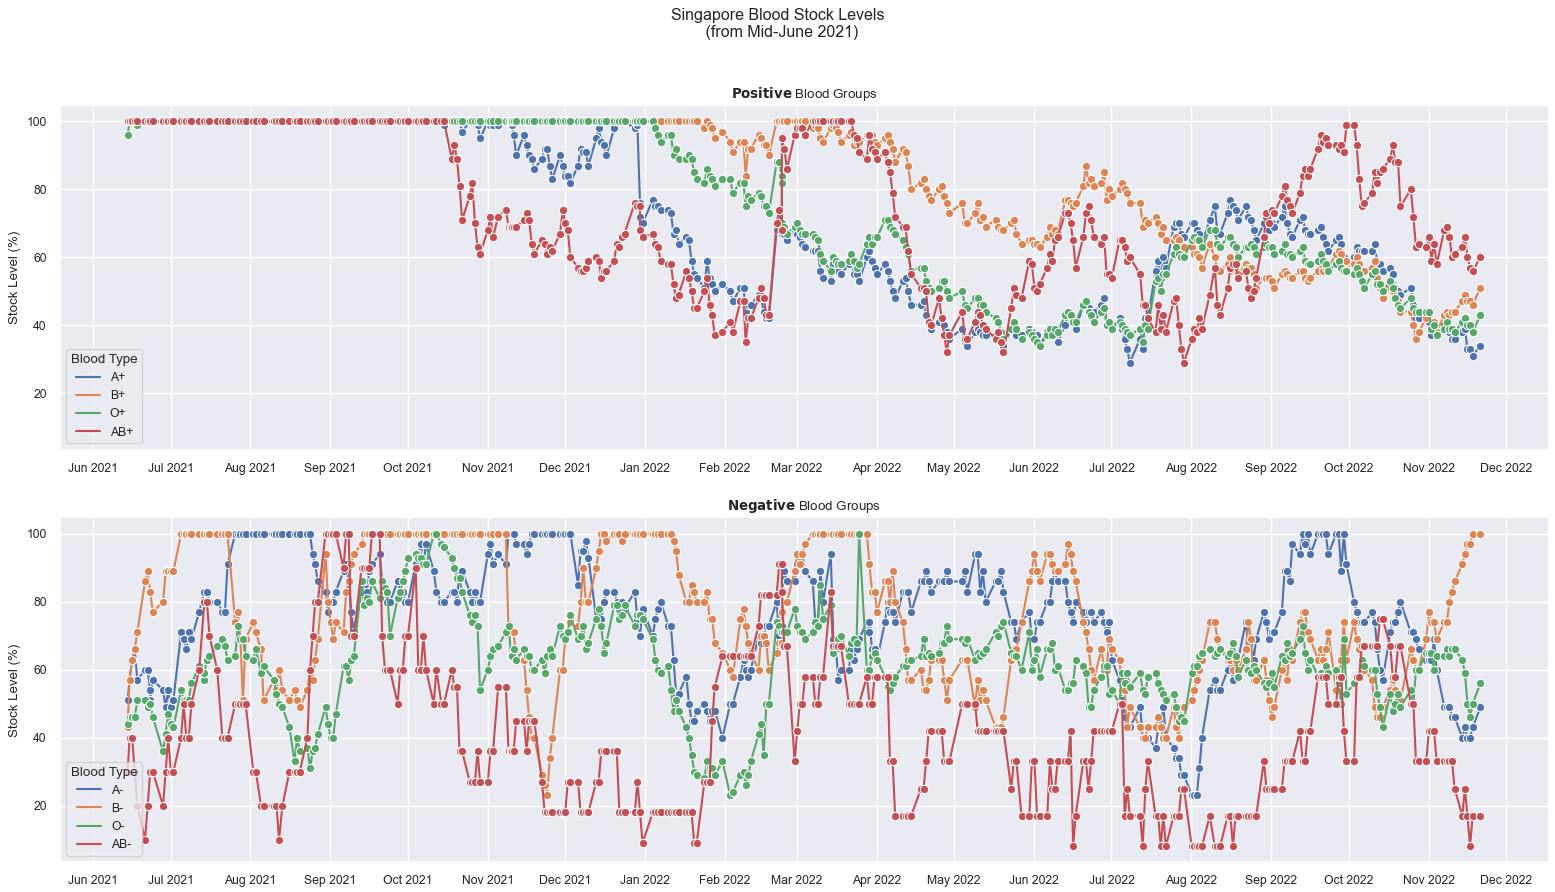
The static graph below only includes data until mid-November 2022.
 If you’re on mobile, you can press and hold on this image and open it in a new tab.
Graph format and data frequency
This is a subset of the full data, just as an example of the data format and some insights.
-
The x-axis represents time.
-
The y-axis represents the reported blood stock level, from 0% to 100%. In this observation period, the stocks never hit 0%, but a few blood types spent a significant amount of time at 100%.
- One thing we don’t know if 100% represents the same number of units of blood for every blood type. Since the demand for blood varies across blood types, maybe the target 100% amount is different for each?
-
Each dot on each line represents one observation.
- Notice that the dots are not evenly spaced. The blood stocks only update on weekdays! They also don’t seem to update on public holidays. For instance, 4th November 2021, Thursday, the day of Deepavali, is missing. This probably points to a human-in-the-loop system.
Some questions
Disclaimer again that I’m not an expert. The Red Cross has facts and figures here and an infographic of 2021 blood usage here.
These are just some layman questions:
- Is blood demand / supply seasonal? How best can we understand these trends?
- What changed in Mid-Oct 2021 to lower positive-type blood supply so much?
- What happened to B- stock in Nov 2021?
- How much do blood drives affect stock levels?
- and many others
Please feel free to download and analyze this data as well.
Wrapping up
This data is all a side effect of @sgbloodstocksbot, so hopefully both the data and bot turn out to be useful. Please feel free to drop me a message if you’re interested in anything related to this :)